Home › Forums › Google Sheets & Forms › Parent Survey Results
Tagged: Form, Google Form, Google Sheet, Graphs, Health Survey, Printing, Rhonda Hamilton-Cross, Survey
- This topic has 2 replies, 2 voices, and was last updated 8 years, 9 months ago by
 Rob Clarke.
-
AuthorPosts
-
-
October 27, 2017 at 11:46 am #3691
Hi Rob,
I have a Form for parent survey which I need to print graphs from for the BOT meeting on Monday.
For some reason when I print it in portrait, the sexuality graph disappears – whereas if I print in landscape, the physical activity disappears!
If I share the Form with you, would you help me sort this out, please?
Rhonda
-
This topic was modified 8 years, 9 months ago by Rob Clarke.
-
This topic was modified 8 years, 9 months ago by Rob Clarke.
-
This topic was modified 8 years, 9 months ago by
-
October 27, 2017 at 12:28 pm #3696
 Rob ClarkeKeymaster
Hi Rhonda,
Thanks for calling me. I see you are using the Form to look at the survey results which is a good start. Some pointers:
- A Google Form has inbuilt responses which you can analyse individually or summarise, which produces graphs.
- The Form isn’t really designed to print out – they are online tools so it takes a bit of extra effort to make it work well if you have to print it out.
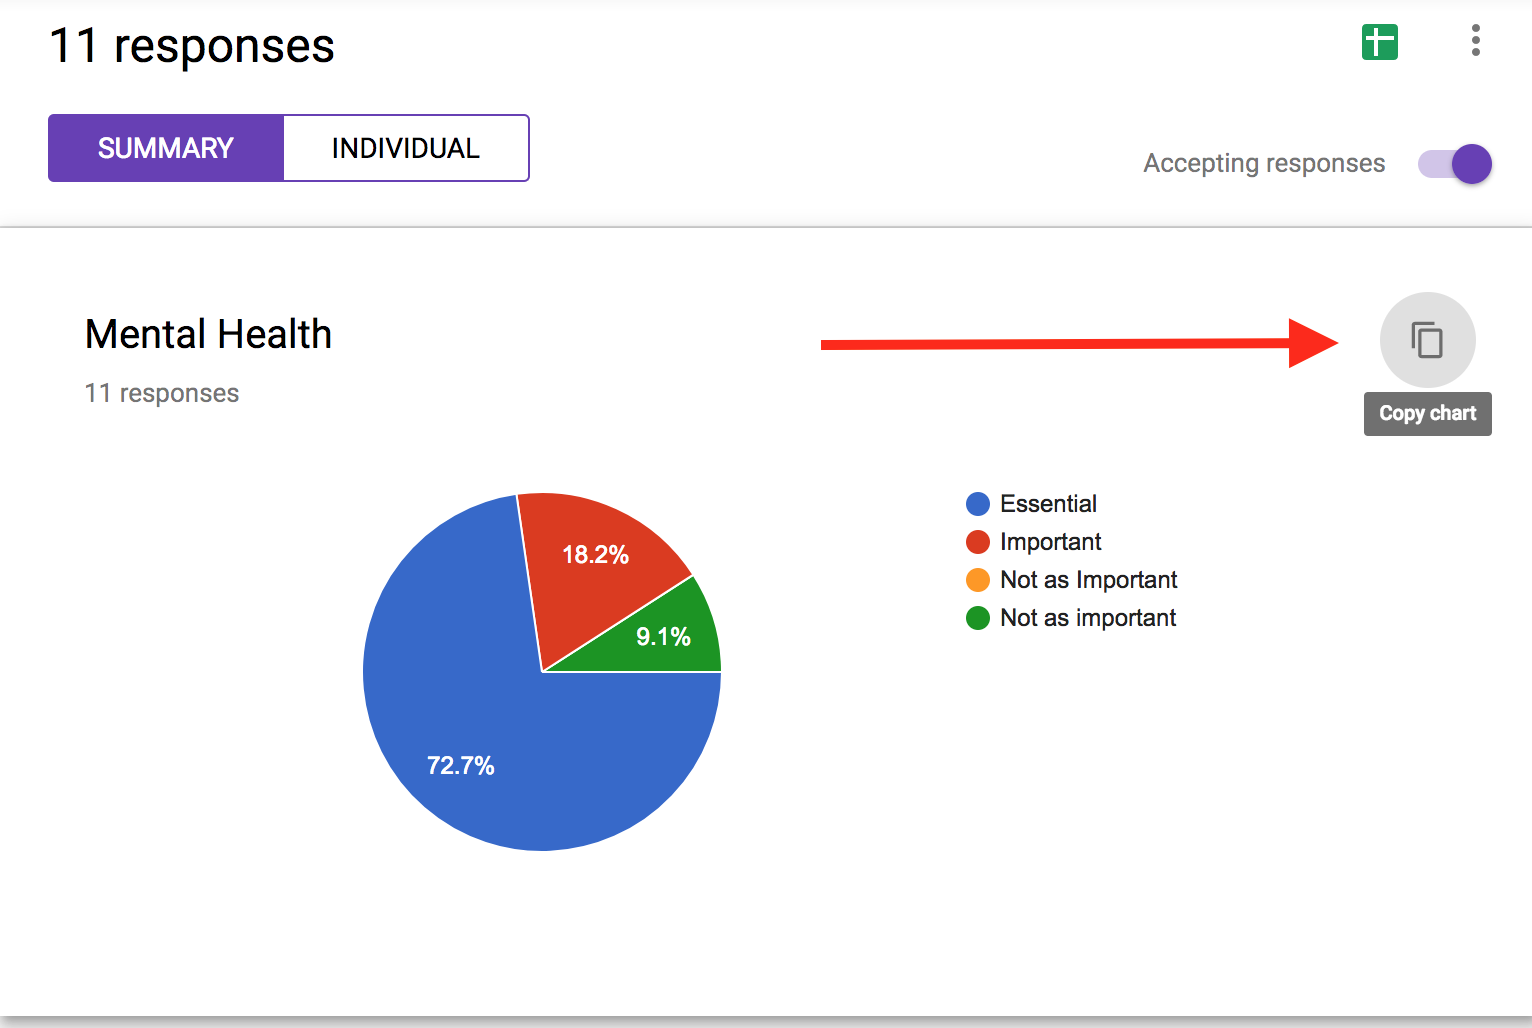
- You can choose to ‘Copy’ the chart and then paste it somewhere else, which is probably a good thing – as in this first screenshot:
- Now, if you choose to print out your responses, this is where it is likely to turn to custard…
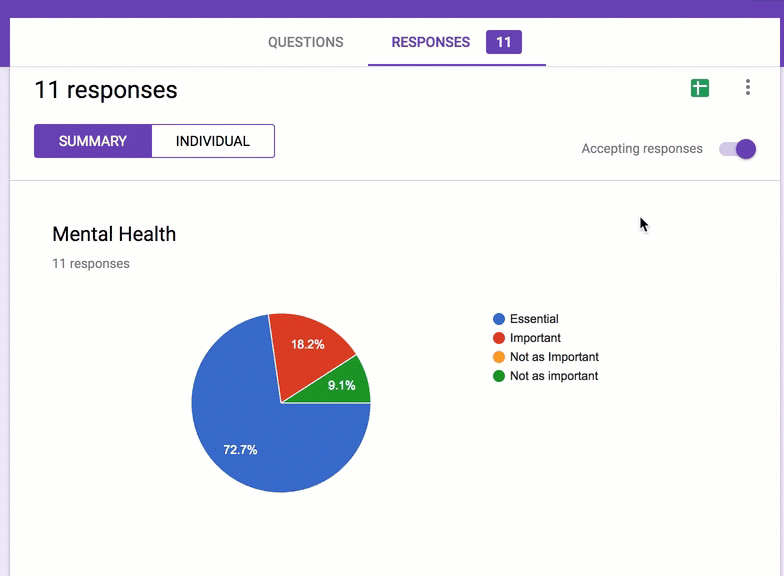
- As you’ll see at the end of this animation above, it is asking to print out individual responses which isn’t what your Board will want. Let’s not kill trees…
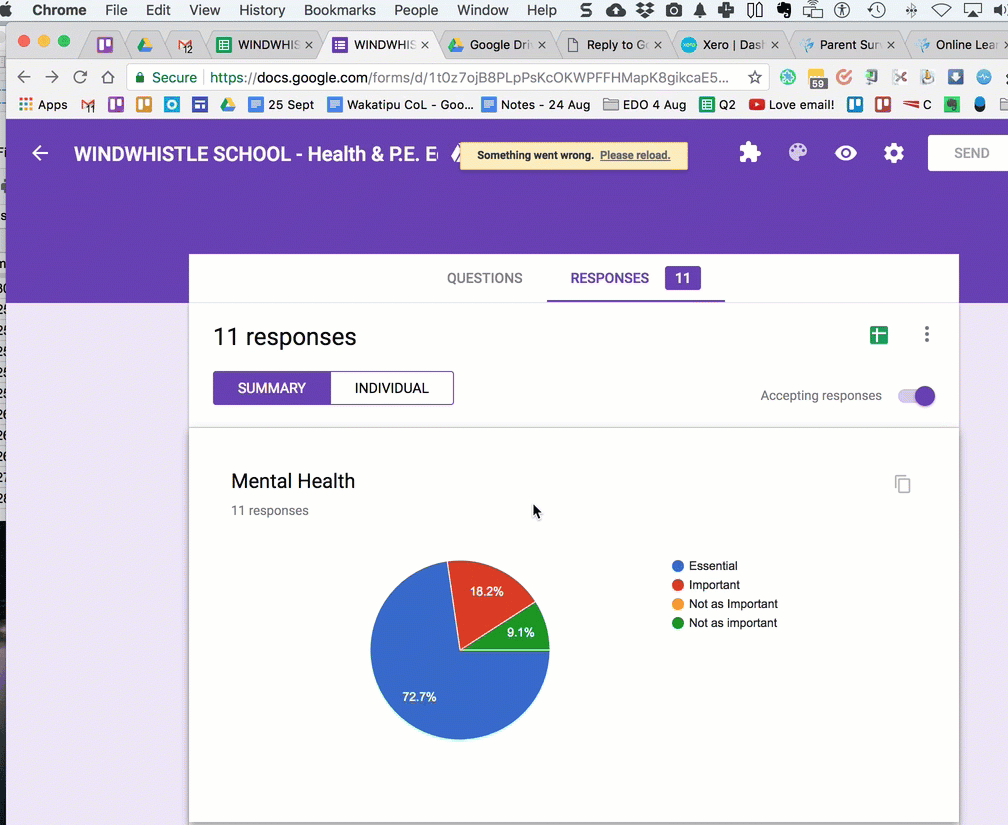
- You <span style=”text-decoration: underline;”>could</span> use the print feature from your web browser (File > Print) as I do in this next animation, which on my Mac gives a better result along with the graphs, but as you mention it isn’t working for all paper orientations (ie. portrait or landscape)…
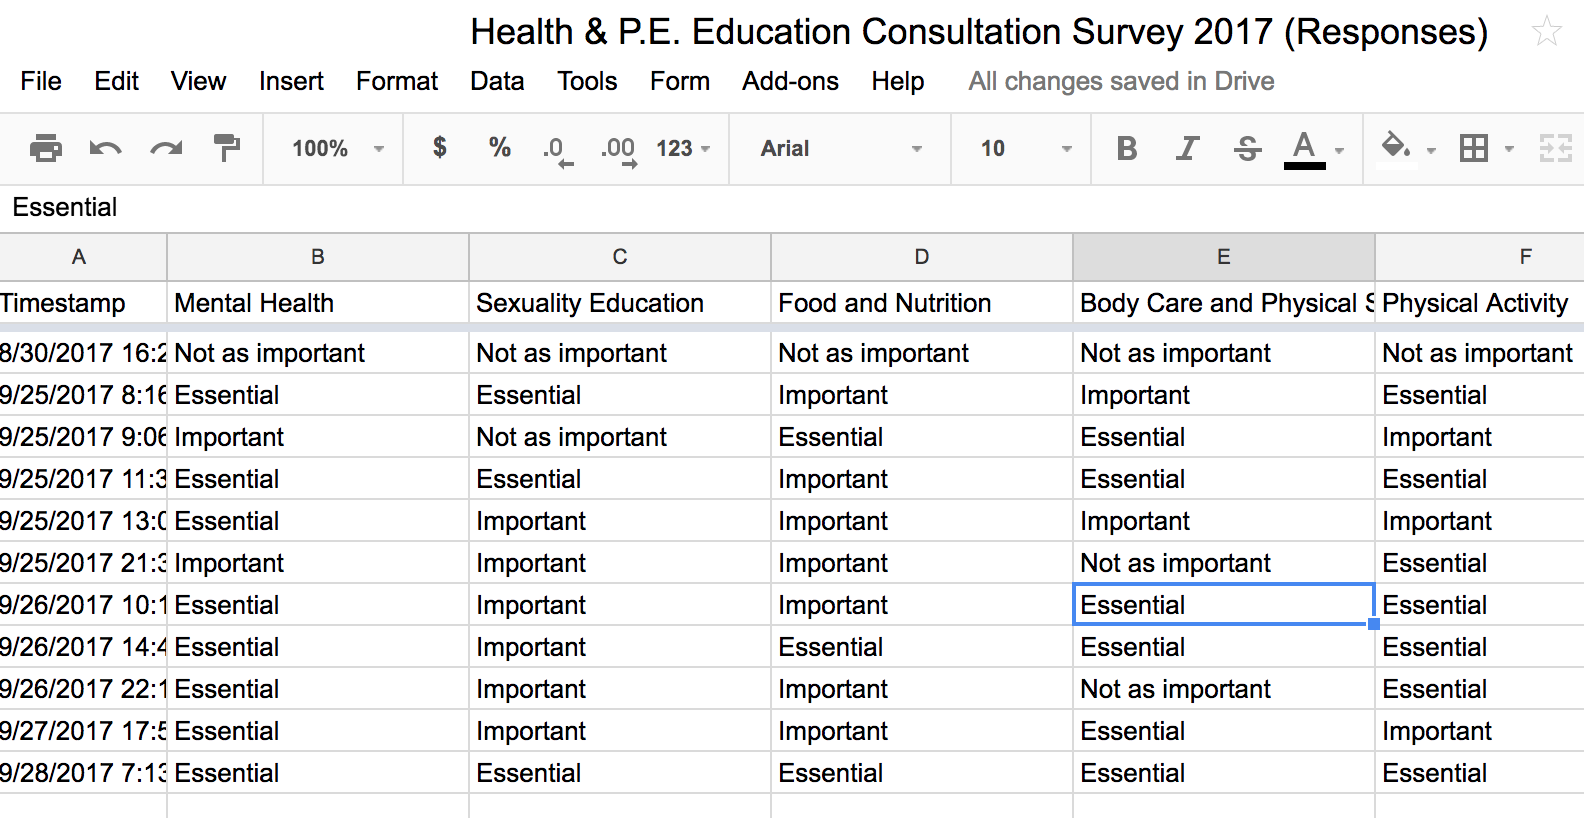
My suggestion is to open the results in a Google Sheet, then turn them into a graph or a series of graphs. This is where you/Frances may need to come back to me, but I’ll have a guess at what your BOT may want in the following…
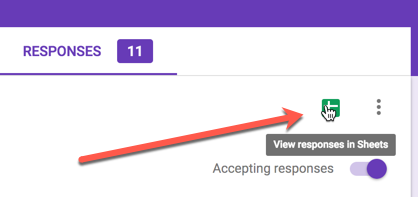
- Click on the little green icon top right inside your Responses tab of the Form.
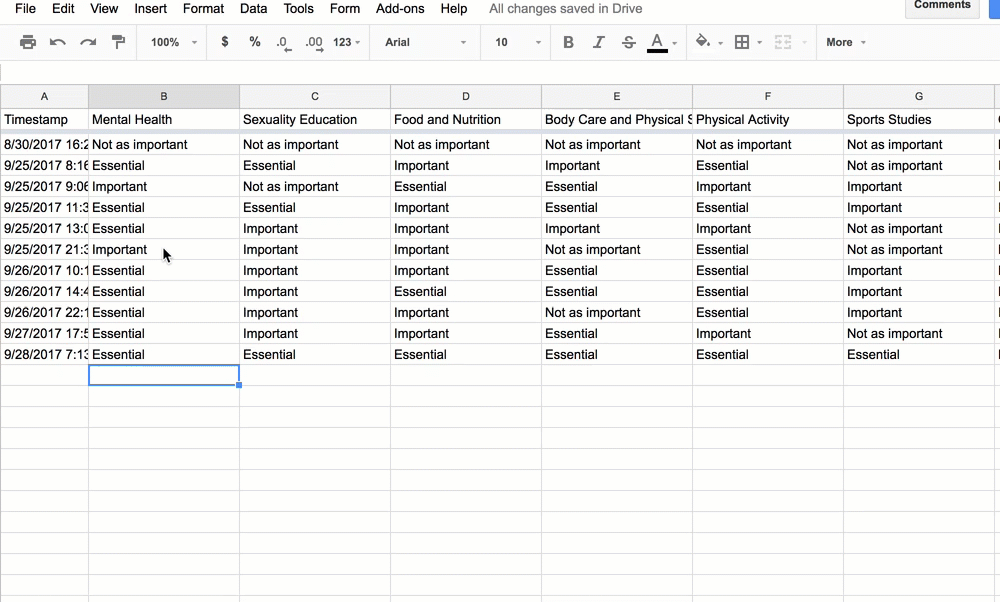
- This will launch a Google Sheet with the results, but they won’t have the graphs… yet.
- Select the column of data to graph – in this case ‘mental health’
- Next, I suggest you move it to its own tab within the Sheet – this will make printing easier:
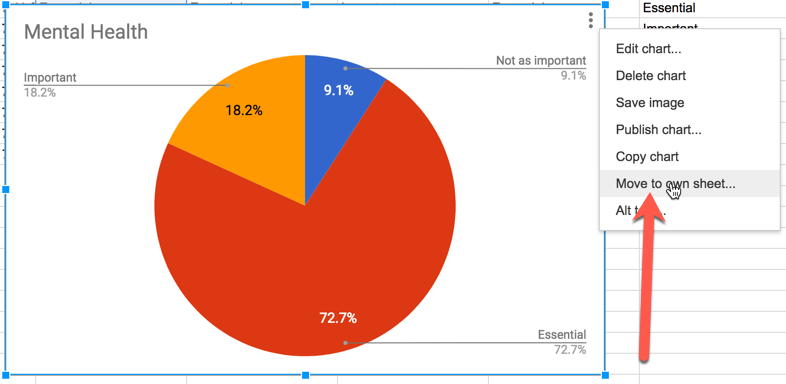
- If you select ‘Edit chart…’ then you get all sorts of options, from chart style to labeling the segments of the graph, etc.
Let me know how you go with this – I can pop back into the Sheet if you need it on Monday.
Rob
-
This reply was modified 8 years, 9 months ago by Rob Clarke.
-
October 27, 2017 at 12:47 pm #3698Rob ClarkeKeymaster
 PS – if you check out the lesson ‘Creating Graphs‘ inside the Sharing Information module of the Google Sheets & Forms course that will help also 😉
-
-
AuthorPosts
- You must be logged in to reply to this topic.